Dean Dunham 9pm - 10pm
3 November 2020, 13:32

An Oxford scientist has accused the government of using "misleading and incorrect" graphs to justify England's second lockdown, saying that Covid-19 infections are actually "flatlining".
Professor Carl Heneghan, from Oxford University's Centre for Evidence-Based Medicine, said on Tuesday that one of the graphs used by the Government has already been "proven to be out of date".
He criticised the "out dated" estimates used by the Prime Minister and Government scientific advisors.
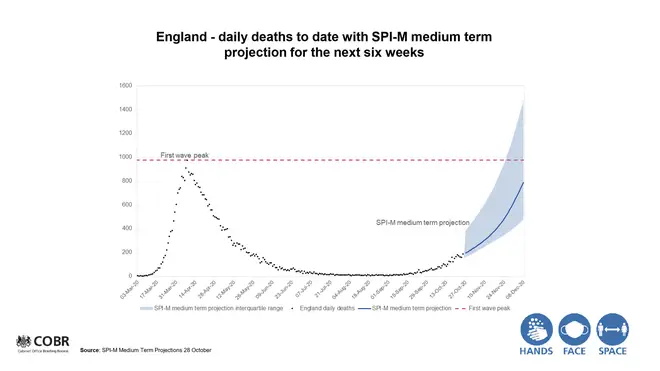
One graph used during the Saturday night coronavirus briefing, which suggested there could be up to 4,000 deaths per day by December, was "mathematically incorrect", he said.
The scientist also stated that this graph should "never have been used".
Read more: Covid-related deaths rise by 46 percent in a week in England and Wales
Read more: Liverpool first city to get rapid response tests

Professor Heneghan explained that the 4,000 deaths per day graph shown on Saturday was "based on data that was weeks out of date" and using a model based on the projection that there would be 1,000 deaths per day by now, the start of November.
Professor Heneghan, who has been an outspoken critic of the Government's choice to put England into a second lockdown, said that coronavirus infections in England have stopped accelerating.
Although deaths will continue to rise for weeks because of infections that have already happened, he said they would slow down accordingly.
Read more: Robert Jenrick tells LBC he 'doesn't know' how many tests are needed for Liverpool scheme
Read more: Government plans to return to Covid Tier system after December 2, PM says

Second lockdown is "a disaster," says senior Tory Sir Desmond Swayne
Professor Heneghan said on Tuesday: "Right now cases are shifting in a way they weren't three weeks ago.
"They are starting to flatline.
"Admissions are flatlining and, in effect, deaths are starting to flatline so there will be an update, I hope, on this system tomorrow on Wednesday that will give us a clear understanding of where we're going.
"Also today ONS will be reporting on excess deaths, so the next 24 hours will give much more useful information that should inform whether a lockdown should occur or not."
Speaking about his assertion that deaths are "flatlining", he said: "So one of the things about hospital admissions is it doesn't take into account discharges, it also doesn't tell you who that person is, for instance everybody going into hospital is being tested.
"If you look at the patients in hospital data, that's a much more useful measure and if you look at that on the 31st October it was 9,213 and it actually dropped for the first time on 1st November to 9,077 by about 130 patients.
"That's the first drop in over a month on that data set. So I would look at patients in hospital, not the number being actually admitted which is very variable and quite noisy in what its context is."

James O'Brien caller posits biggest mistake PM made in handling Covid
His comments come as statistics revealed that the number of weekly deaths involving coronavirus has jumped by nearly 50 per cent in a week to reach the highest level since early June.
Just under 63,000 deaths involving Covid-19 have now occurred in the UK, new figures show.
A total of 61,257 deaths have so far been registered in the UK where Covid-19 was mentioned on the death certificate, according to the latest reports from the UK's statistics agencies.
This includes 55,796 deaths in England and Wales up to October 23 (and registered up to October 31), which were confirmed by the ONS on Tuesday.
Since these statistics were compiled, a further 1,428 deaths are known to have occurred in England, plus 67 in Scotland, 90 in Wales and 80 in Northern Ireland, according to additional data published on the Government's coronavirus dashboard.
Together, these totals mean that so far 62,922 deaths involving Covid-19 have taken place in the UK.