House prices rise astronomically over 10-year period - is your house now worth double what you paid?
12 April 2023, 13:56
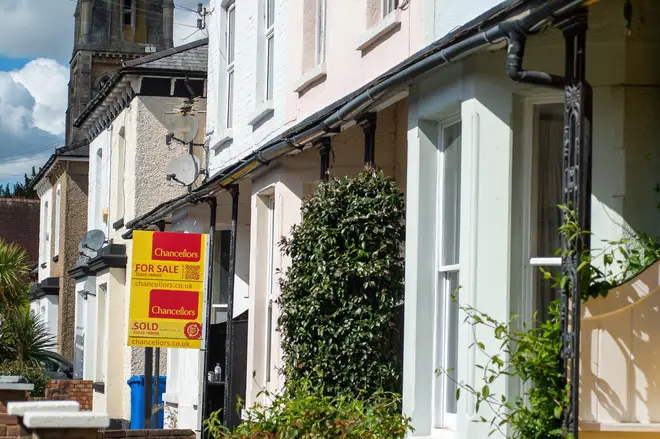


House prices are continuing to soar right across Britain - defying the mortgage rate crisis and lesser affordability because of the skyrocketing cost-of-living.
Data from the Office of National Statistics (ONS) shows that in the last ten years, house prices have doubled in some areas of the UK.
Areas in London and the south-east of England have seen wide-ranging hikes in prices since 2013 - with Waltham Forest in north-east London seeing the highest average rise.
Average property prices in the London borough have risen 119% from £235,210 to £515,320 in the last ten years - with Thames Estuary districts of Hastings and Thanet seeing similar inflation of 115% over the same period.
North Northamptonshire saw the biggest leap in prices outside of the south-east as dwellings in the East Midlands area jumped from an average of £137,000 to £279,900 over the ten-year period - a jump of 104%.
More bad news for prospective first-time buyers is that after the record growth in prices, there is now no area in the UK which boasts average property prices under £100,000.
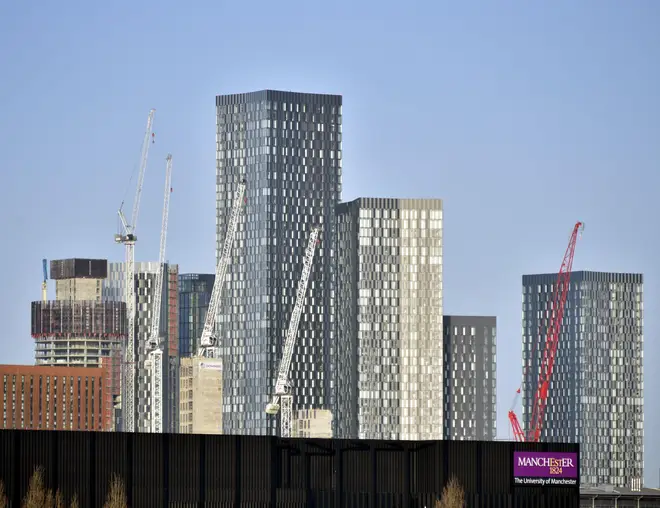
But it isn't just southern areas experiencing a boom: four of the top 20 areas for rises are in the Greater Manchester areas as young Brits increasingly shun the expensive hub of London for England's second city.
Tameside, Trafford, Salford and the city centre all saw rises of over 99% in the decade.
Despite the astronomical price rises, prices are likely to slow down due to a combination of rate rises and affordability concerns hamper prospective buyers in their ambitions.
Read More: Average UK house prices have fallen for seven months in a row – Nationwide
The full list of the top 50 house price hike areas is below:
Waltham Forest, London - From £235,210 to £515,320, up 119%
Hastings, South East - From £137,090 to £295,030, up 115%
Thanet, South East - From £147,950 to £318,150, up 115%
Barking and Dagenham, London - From £167,410 to £356,960 113%
City of Bristol, South West - From £177,130 to £363,230, up 105%
North Northamptonshire, East Midlands - From £137,000 to £279,900, up 104%
Medway, South East - From £150,860 to £307,090, up 104%
Rochford, East - From £217,650 to £442,360, up 103%
Thurrock, East - From £166,830 to £336,690, up 102%
Basildon, East - From £191,720 to £385,980, up 101%
Tameside, North West - From £106,600 to £214,570, up 101%
Trafford, North West - From £187,750 to £377,100, up 101%
Swale, South East - From £158,910 to £318,680, up 101%
Newham, London - From £214,080 to £429,230, up 100%
Stevenage, East - From £175,270 to £351,260, up 100%
Manchester, North West - From £118,110 to £236,510, up 100%
Southend-on-Sea, East - From £176,600 to £353,620, up 100%
Salford, North West - From £109,520 to £218,2600, up 99%
Castle Point, East - From £193,830 to £384,4900, up 99%
Fenland, East - From £126,280 to £249,210, up 97%
Central Bedfordshire, East - From £195,880 to £386,070, up 97%
Bexley, London - From £207,250 to £406,280, up 96%
Havering, London - From £223,110 to £437,070, up 96%
City of Nottingham, East Midlands - From £99,010 to £193,860, up 96%
Luton, East - From £147,660 to £286,940, up 94%
Harlow, East - From £170,560 to £331,240, up 94%
South Gloucestershire, South West - From £187,790 to £364,200, up 94%
Folkestone and Hythe, South East - From £174,650 to £338,560, up 94%
Causeway Coast and Glens, Northern Ireland - From £100,690 to £194,760, up 93%
Leicester, East Midlands - From £121,670 to £234,740, up 93%
Gedling, East Midlands - From £131,340 to £253,000, up 93%
Dover, South East - From £167,190 to £321,530, up 92%
Rugby, West Midlands - From £161,210 to £309,870, up 92%
Gravesham, South East - From £176,080 to £338,220, up 92%
Croydon, London - From £225,660 to £433,340, up 92%
Blaenau Gwent, Wales - From £71,610 to £137,210, up 92%
Blaby, East Midlands - From £159,390 to £304,870, up 92%
Rhondda Cynon Taf, Wales - From £85,990 to £164,460, up 91%
Stockport, North West - From £160,380 to £306,340, up 91%
City of Peterborough, East - From £131,600 - £251,160, up 91%
Bury, North West - From £126,840 to £241,920, up 91%
Milton Keynes, South East - From £172,070 to £328,060, 91%
Tendring, East - From £151,280 to £288,370, up 91%
Dartford, South East - From £191,720 to £364,690, up 90%
Rossendale, North West - From £105,370 to £200,200, up 90%
Lewisham, London - From £245,170 to £465,350, up 90%
Breckland, East - From £158,040 to £299,120, up 89%
Bedford, East - From £188,980 to £357,630, up 89%
City of London, London - From £492,810 to £931,090, up 89%
Ashfield, East Midlands - From £102,680 to £193,490, up 88%